Edmonton Market Report Infographics
Infographics: June 2025 RAE Edmonton Market Reports

Growing options for buyers with strong prices bringing sellers to market
Activity in the Greater Edmonton Area (GEA) residential real estate market remained robust in June 2025, with 2,877 homes sold and 4,215 new listings added to the REALTORS® Association of Edmonton’s (RAE) MLS® System. While sales dipped 2.8% and new listings declined 10.9% compared to May 2025, year-over-year trends remain positive. Residential unit sales were up 1.2% from June 2024, and new listings saw a notable 15.8% increase from the same time last year. Inventory levels also edged upward, with 6,768 residential properties available at the end of June, up 3.8% from May and 15.0% higher than a year ago.
The average selling price across all residential property types rose 0.1% from May to $464,955, up 5.9% year-over-year. The MLS® Home Price Index (HPI) composite benchmark price in the GEA was $439,700, reflecting a 0.1% increase from May 2025 and a 7.7% increase from June 2024.
“June’s market remained steady overall, with year-over-year gains in sales and listings. However, we’re starting to see signs of a slowdown in some categories—particularly semi-detached and row/townhomes, where sales dipped and time on market increased. That said, with inventory growing and strong listing activity, the Greater Edmonton Area continues to offer opportunity for both buyers and sellers as we head into the second half of the year.” –Darlene Reid, 2025 Board Chair, REALTORS® Association of Edmonton
Read the full report on RAE website!
The following data is a comparison between June 2025 and June 2024 numbers, and is current as of July of 2025. For last month’s numbers, check out our previous RAE infographic!
You can also click here to view all our Edmonton infographics.
Download Printable Version – June 2025 RAE, Edmonton Report

Infographics: May 2025 RAE Edmonton Market Reports
Inventory rising in Edmonton could be a sign of a shifting property market
There were 2,967 residential unit sales in the Greater Edmonton Area (GEA) real estate market during May 2025, representing a 9.7% increase from April 2025 and a 7.9% decrease from May 2024. New residential listings totalled 4,917, representing a 27.8% increase from April 2025 and a 16.1% increase over the previous year. The overall inventory in the GEA increased 19.9% month-over-month and 13.2% year-over-year.
The total number of Detached units sold was 1,730, representing a 9.8% increase over the previous month and an 8.9% decrease compared to sales in May 2024. With 289 units sold in May 2025, semi-detached sales were down 5.9% month-over-month and 19.3% year-over-year. Row/Townhouse unit sales increased 23.9% compared to April 2025 and 11.3% compared to May 2024. Apartment Condominium unit sales were up 7.4% from the previous month and down 12.6% from the previous year.
The total residential average price in May 2025 was $464,277, decreasing 1.4% from the previous month and reflecting an overall growth of 5.2% compared to May 2024. Detached home prices averaged $579,704, representing a 1.0% decrease from April 2025 and a 6.2% increase over the previous year. Semi-detached units sold for an average of $439,857, representing a 1.1% increase from the last month and a 6.0% year-over-year increase. Row/townhouse prices decreased by 2.7% from April 2025 and increased 4.3% compared to May 2024, with an average selling price of $306,796. Apartment Condominium average prices fell 2.1% from the previous month to $213,792, ending the month 3.4% higher than May of last year.
Read the full report on RAE website!
The following data is a comparison between May 2025 and May 2024 numbers, and is current as of June of 2025. For last month’s numbers, check out our previous RAE infographic!
You can also click here to view all our Edmonton infographics.
Download Printable Version – May 2025 RAE, Edmonton Report

Infographics: April 2025 RAE Edmonton Market Reports
Change in recent inventory trend signals a busy market ahead
There were 2,710 residential unit sales in the Greater Edmonton Area (GEA) real estate market during April 2025, representing a 9.0% increase from March 2025 and a 13% decrease from April 2024. New residential listings totalled 4,012, representing a 9.8% increase from March 2025 and a 4.8% increase over the previous year. The overall inventory in the GEA increased 12.1% month-over-month and 0.3% year-over-year.
The total number of Detached units sold was 1,576, representing a 10.2% increase over the previous month and a 14.7% decrease compared to sales in April 2024. With 307 units sold in April 2025, semi-detached sales were up 15.4% month-over-month and down 11.3% year-over-year. Row/Townhouse unit sales increased 5.1% compared to March 2025 and recorded 4.2% fewer sales than in April 2024. Apartment Condominium unit sales were down 14.9% from the previous year and up 4.3% from the month before.
The total residential average price came in at $470,447, increasing 2.1% from the previous month and reflecting an overall growth of 9.0% compared to April 2024. Detached home prices averaged $585,707, representing a 1.8% increase from March 2025 and a 10.4% increase over the previous year. Semi-detached units sold for an average of $434,858, representing a 1.1% increase from the last month and a 6.9% year-over-year increase. Row/townhouse prices increased by 0.1% from March 2025 and 6.7% compared to April 2024, with an average selling price of $314,703. Apartment Condominium average prices rose 0.1% from the previous month to $218,330, ending the month 8.5% higher than April of last year.
Read the full report on RAE website!
The following data is a comparison between April 2025 and April 2024 numbers, and is current as of May of 2025. For last month’s numbers, check out our previous RAE infographic!
You can also click here to view all our Edmonton infographics.
Download Printable Version – April 2025 RAE, Edmonton Report

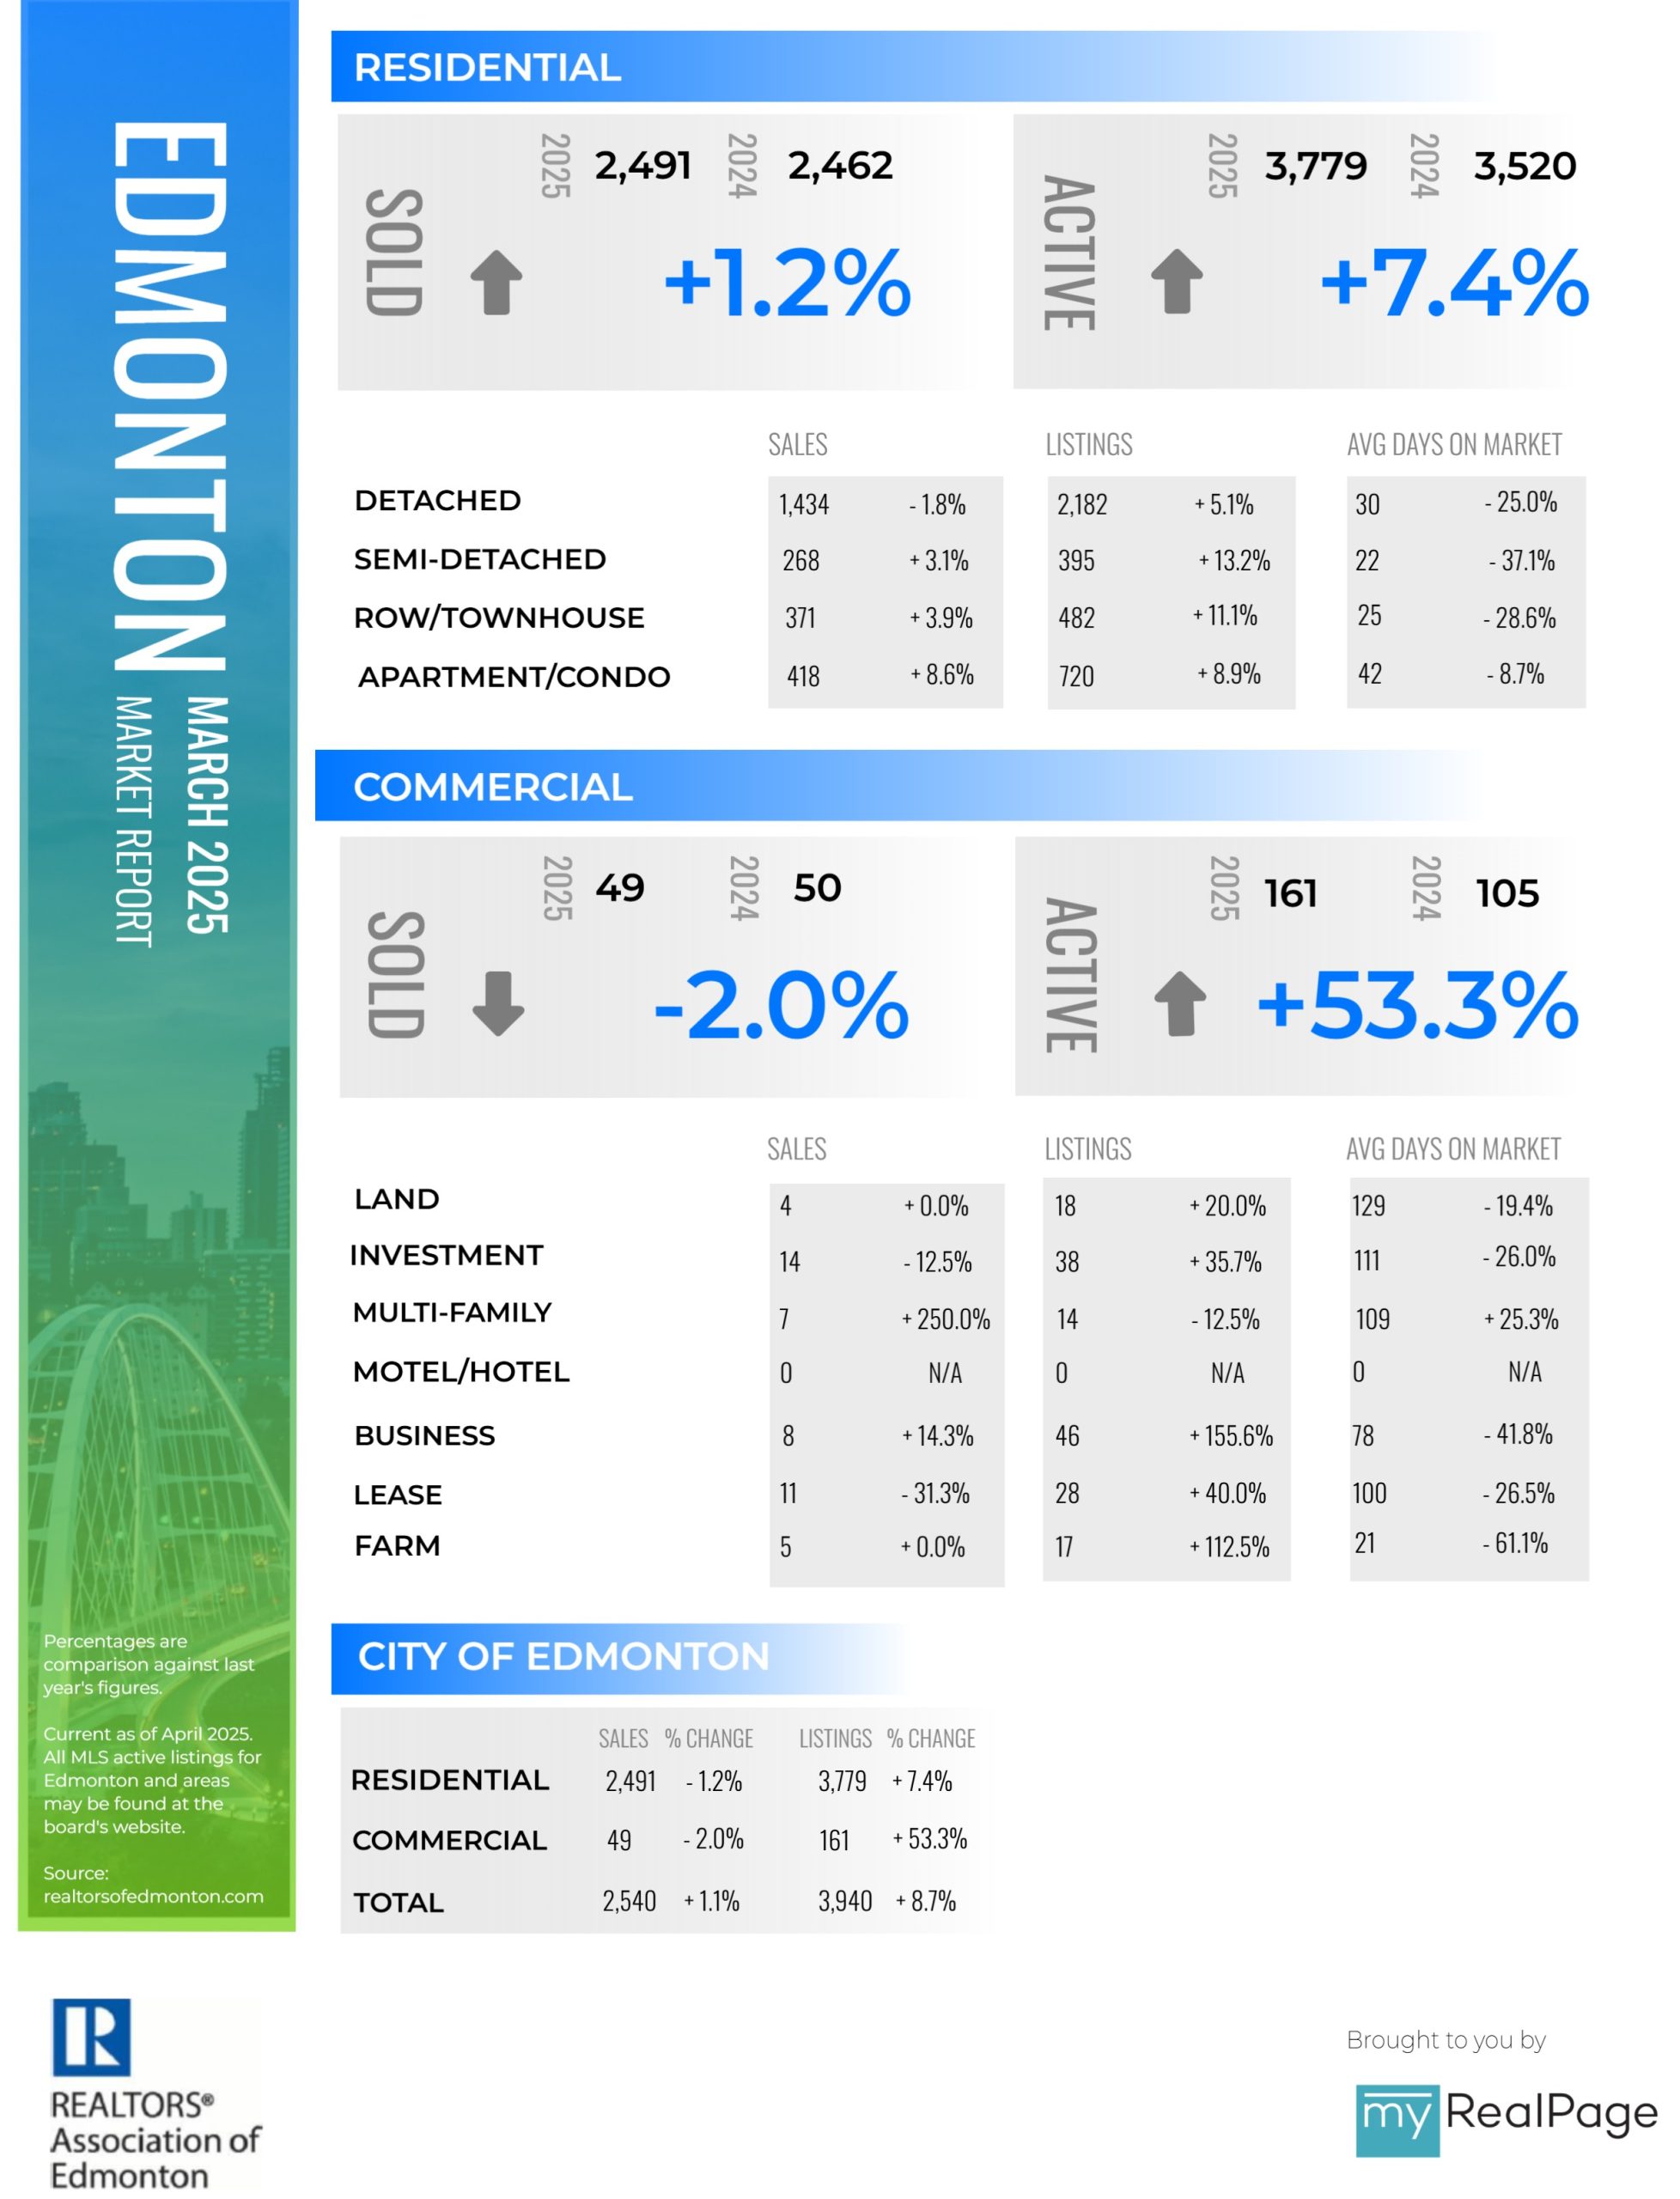
Infographics: March 2025 RAE Edmonton Market Reports
Edmonton home buyers’ options plentiful as new inventory hits the market.
There were 2,494 residential unit sales in the Greater Edmonton Area (GEA) real estate market during March 2025, representing a 36.9% increase from February 2025 and a 1.3% increase from March 2024. New residential listings totaled 3,780, representing a 44.5% increase from February 2025 and a 7.5% increase over the previous year. The overall inventory in the GEA increased 16.6% month-over-month, though levels remain lower year-over-year, decreasing 8.1% from March 2024.
The total number of Detached units sold was 1,434, representing a 41.3% increase over the previous month and a 1.8% decrease compared to sales in March of last year. Semi-detached sales increased 24.7% month-over-month and 3.1% year-over-year, with 268 units sold in March 2025. Row/Townhouse unit sales increased 27.9% compared to February 2025 and recorded 3.9% more sales than March 2024. Apartment Condominium unit sales were up 8.8% from the previous year and 37.8% from the previous month.
The total residential average price came in at $460,685, increasing 2.5% from the previous month and reflecting an overall growth of 9.3% compared to March 2024. Detached home prices averaged $574,872, representing a 1.2% increase from February 2025 and 11.2% higher than the previous year. Semi-detached units sold for an average of $430,646, representing a 2.3% increase from the last month and a 5.3% year-over-year increase. Row/townhouse prices increased by 4.6% from February 2025 and by 11.3% compared to March 2024, with an average selling price of $314,791. Apartment Condominium average prices rose 1.4% from the previous month to $218,052 and ended the month 12.2% higher than the same month one year ago.
Read the full report on RAE website!
The following data is a comparison between March 2025 and March 2024 numbers, and is current as of April of 2025. For last month’s numbers, check out our previous RAE infographic!
You can also click here to view all our Edmonton infographics.
Download Printable Version – March 2025 RAE, Edmonton Report
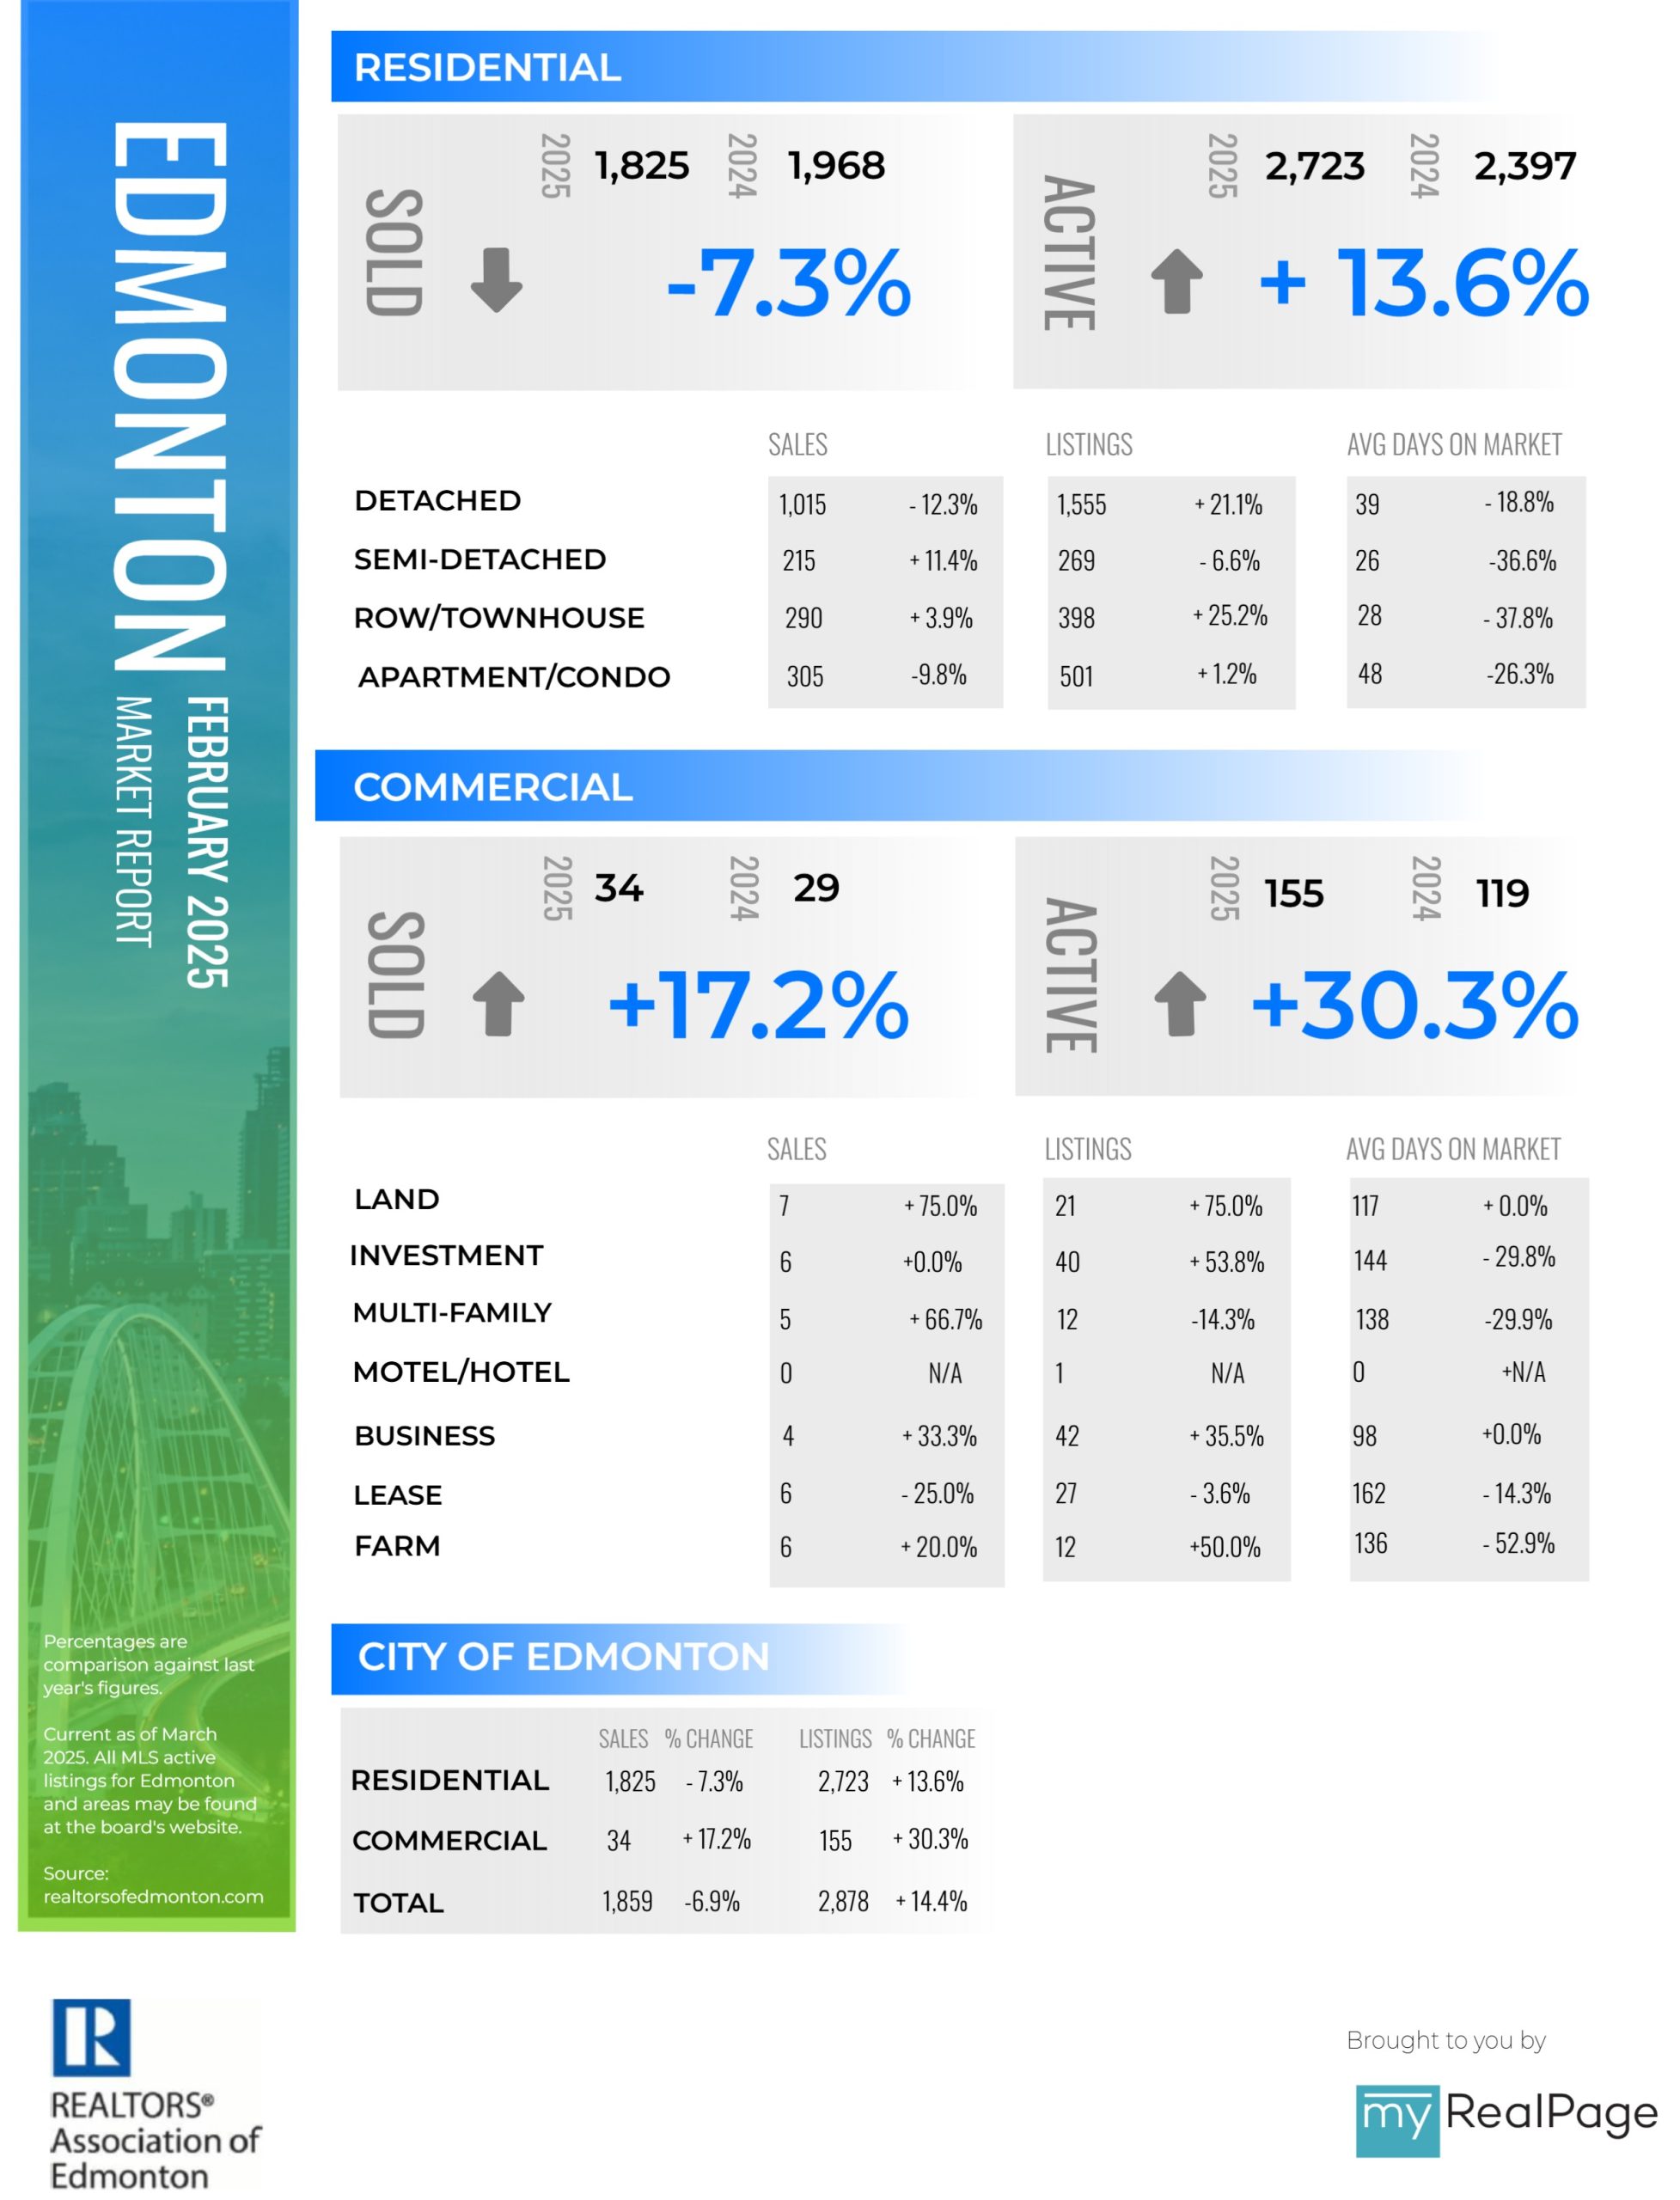
Infographics: February 2025 RAE Edmonton Market Reports
Real estate in the Greater Edmonton Area showing signs of spring thaw
There were 1,825 residential unit sales in the Greater Edmonton Area (GEA) real estate market during February 2025, a 14.3% monthly increase from January 2025 and a 7.1% decrease from February 2024. New residential listings amounted to 2,723, up 13.2% from January 2025 and down 0.4% from the previous year. Overall inventory in the GEA increased 11.4% month-over-month, though levels remain lower year-over-year, decreasing 13.4% from February 2024.
The total number of Detached units sold was 1,015, an increase of 18.6% over the previous month and 12.3% lower than the previous year. Semi-detached sales increased 7.5% month-over-month and 11.4% higher year-over-year, moving 215 units last month. Row/Townhouse unit sales increased 23.4% compared to January 2025 and recorded 3.9% more sales than February 2024. Apartment Condominium unit sales were down 9.2% from the previous year and 0.3% from the previous month.
Total residential average prices came in at $449,554, increasing 2.6% from the previous month and reflecting an overall growth of 10.5% compared to February 2024. Detached home prices averaged $567,913, an increase of 1.2% from January 2025 and 11.9% higher than the previous year. Semi-detached units sold for an average of $420,786, a decrease of 0.1% from the last month and showing an increase of 8.9% year-over-year. Row/townhouse prices were down 3.5% from January 2025 but measured 9.1% higher than last year, with an average selling price of $300,818. Apartment Condominium average prices rose 7.3% from January 2025 to $217,373 and ended the month 19.9% higher than the previous year.
Read the full report on RAE website!
The following data is a comparison between February 2025 and February 2024 numbers, and is current as of March of 2025. For last month’s numbers, check out our previous RAE infographic!
You can also click here to view all our Edmonton infographics.
Download Printable Version – February 2025 RAE, Edmonton Report
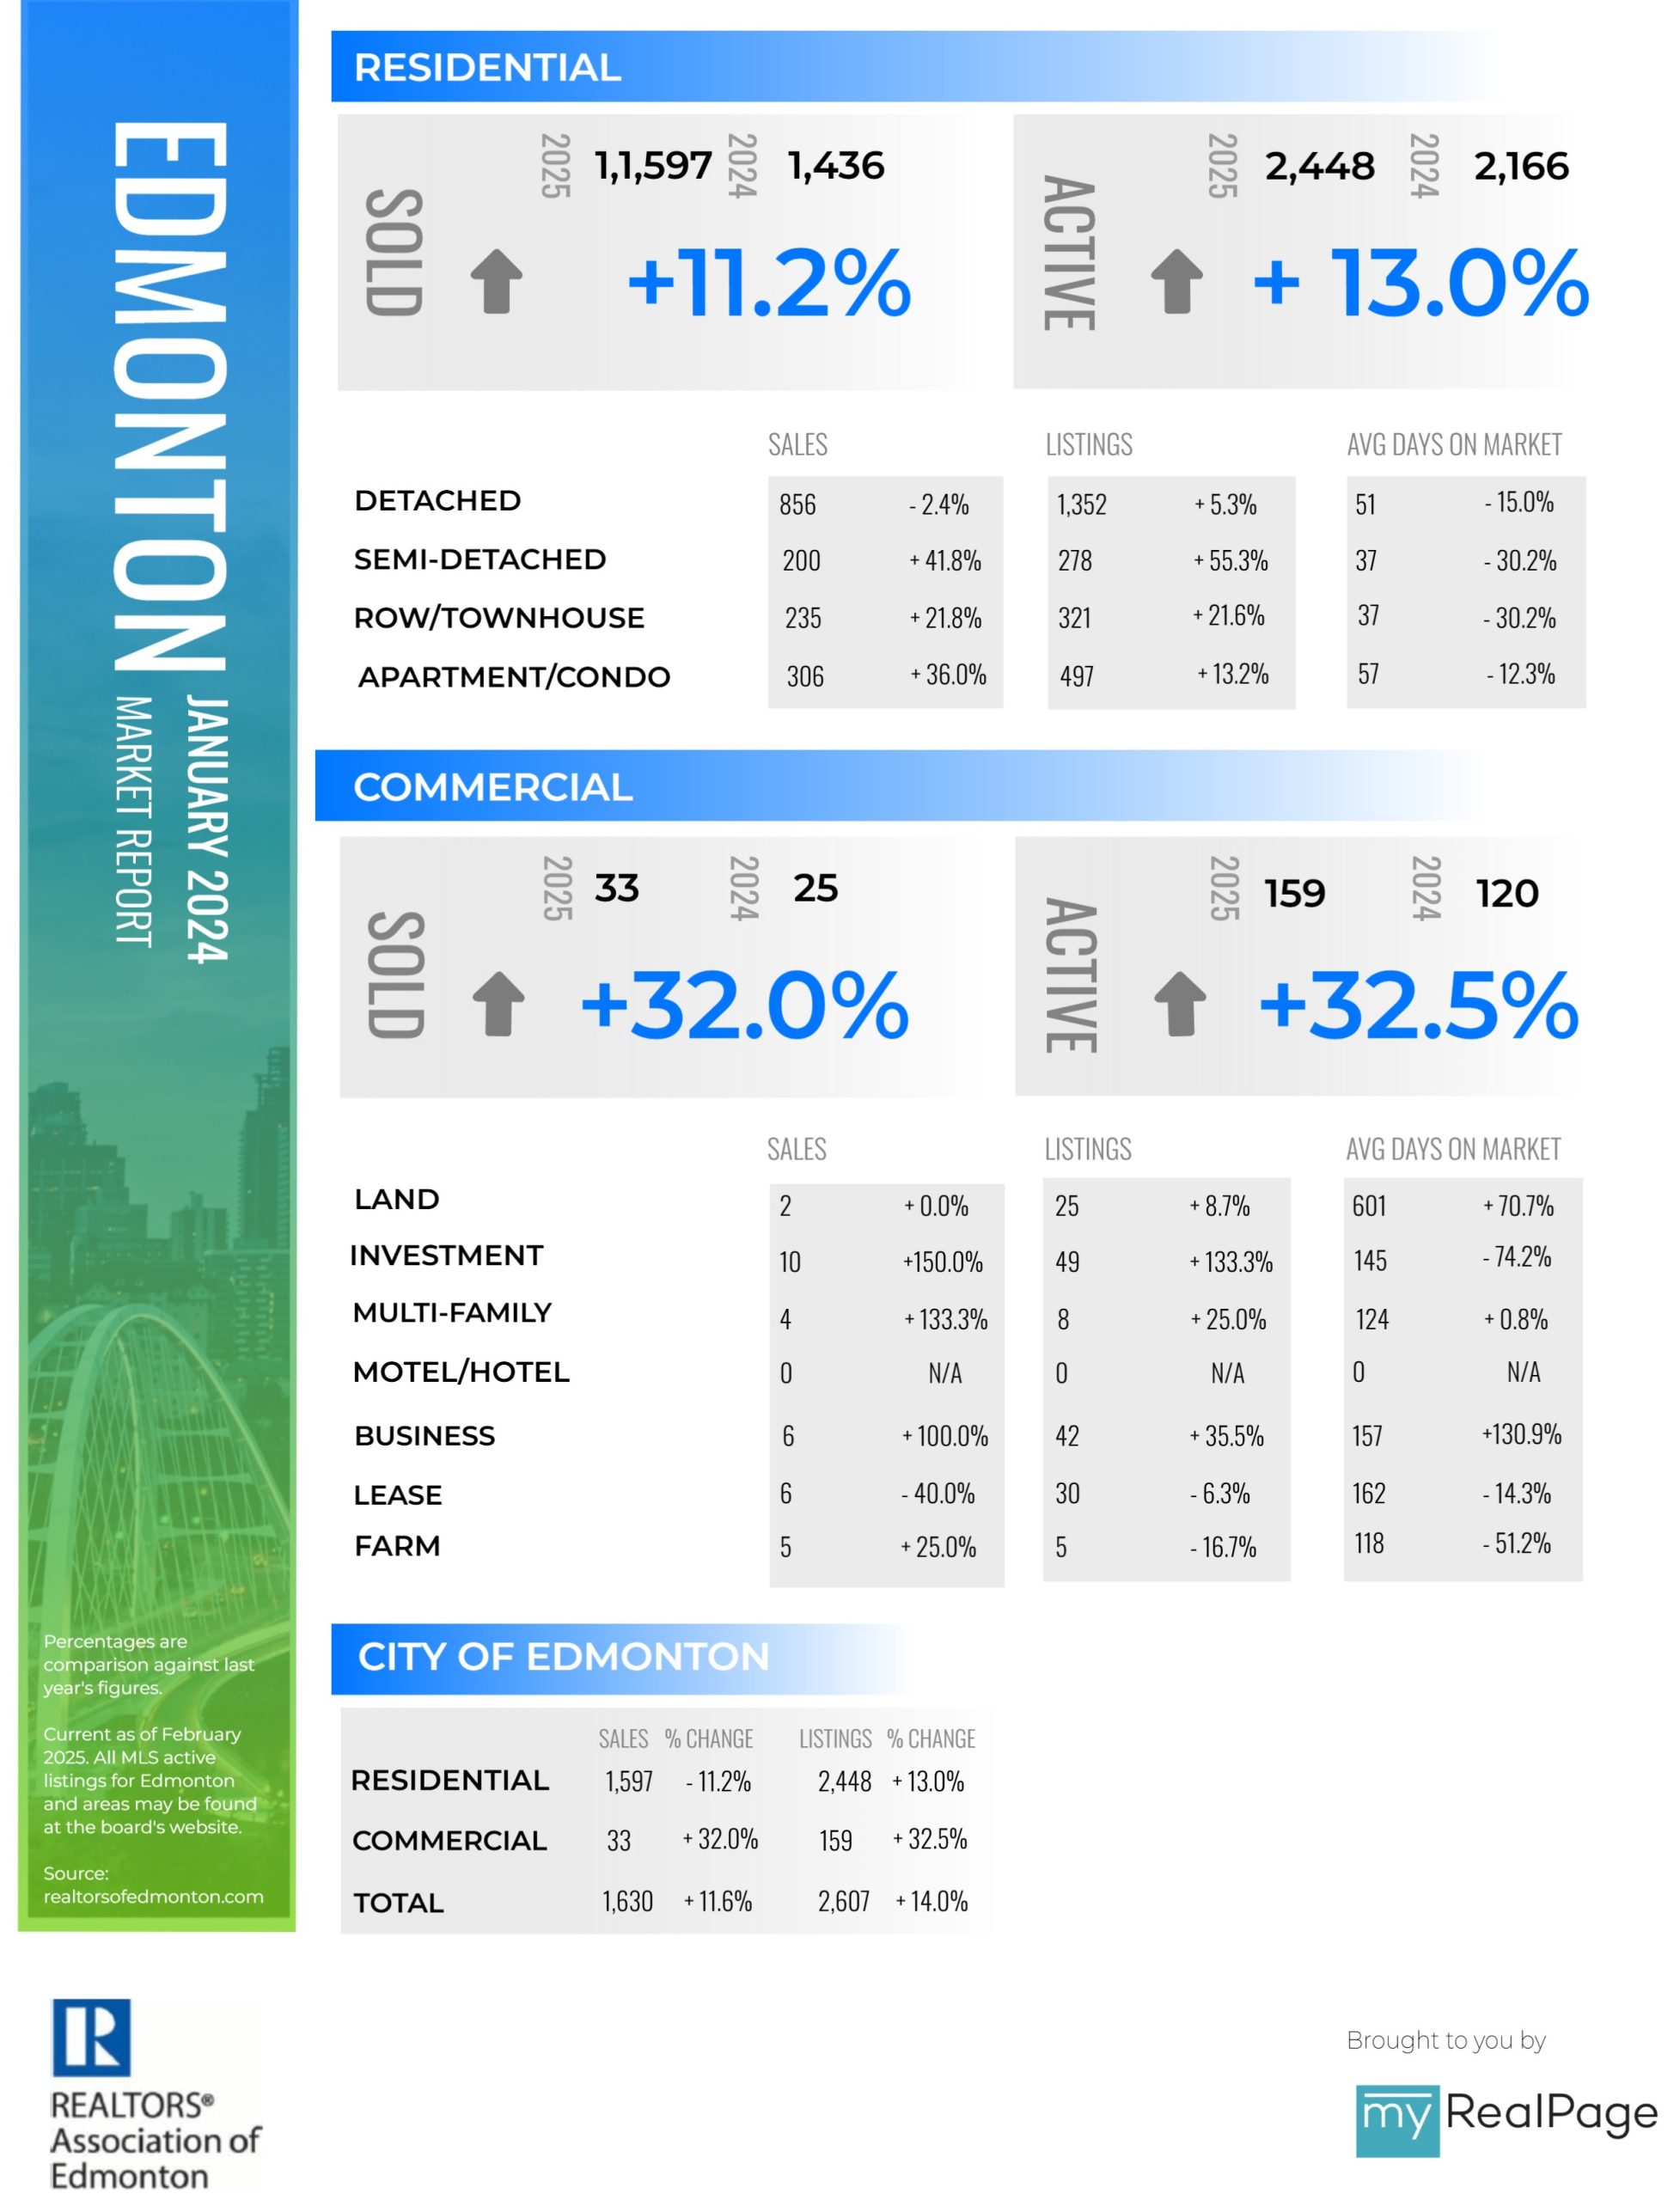
Infographics: January 2025 RAE Edmonton Market Reports
Edmonton housing demand continues to trend upwards as 2025 begins
There were a total of 1,597 residential unit sales in the Greater Edmonton Area (GEA) real estate market during January 2025, a 12.1% monthly increase from December 2024 and an 11.2% annual increase from January 2024. New residential listings amounted to 2,452, up 83.5% from December 2024 and 12.9% from the previous year. Overall inventory in the GEA increased 6.9% month-over-month, while still trending lower year-over-year, showing an 18.2% decrease from January 2024.
The total number of Detached unit sales was 856, an increase of 3.9% over the previous month but 2.4% lower than the previous year. Semi-detached sales increased 22.0% month-over-month and 41.8% higher year-over-year, moving 200 units last month. Row/Townhouse unit sales increased 8.8% compared to December 2024 and recorded 21.8% more sales than January 2024. Apartment Condominium unit sales were 36.0% higher than the previous year and 39.1% higher than December 2024.
Total residential average prices came in at $438,278, showing a minimal 0.8% increase from the previous month and reflecting an overall growth of 9.9% compared to January 2024. Detached home prices averaged $561,282, an increase of 4.2% from December 2024, and coming in 16.2% higher than the previous year. Semi-detached units sold for an average of $420,844, increasing 3.0% from the previous month and 11.2% year-over-year. Row/townhouse prices were up 6.6% from December 2024 and were 15.8% higher than in January 2024 with an average selling price of $311,866. Apartment Condominium average prices fell 0.8% from December 2024 to $202,663 but still ended the month 4.9% higher than the previous year.
Read the full report on RAE website!
The following data is a comparison between January 2025 and January 2024 numbers, and is current as of February of 2025. For last month’s numbers, check out our previous RAE infographic!
You can also click here to view all our Edmonton infographics.
Download Printable Version – January 2025 RAE, Edmonton Report
Infographics: December 2024 RAE Edmonton Market Reports
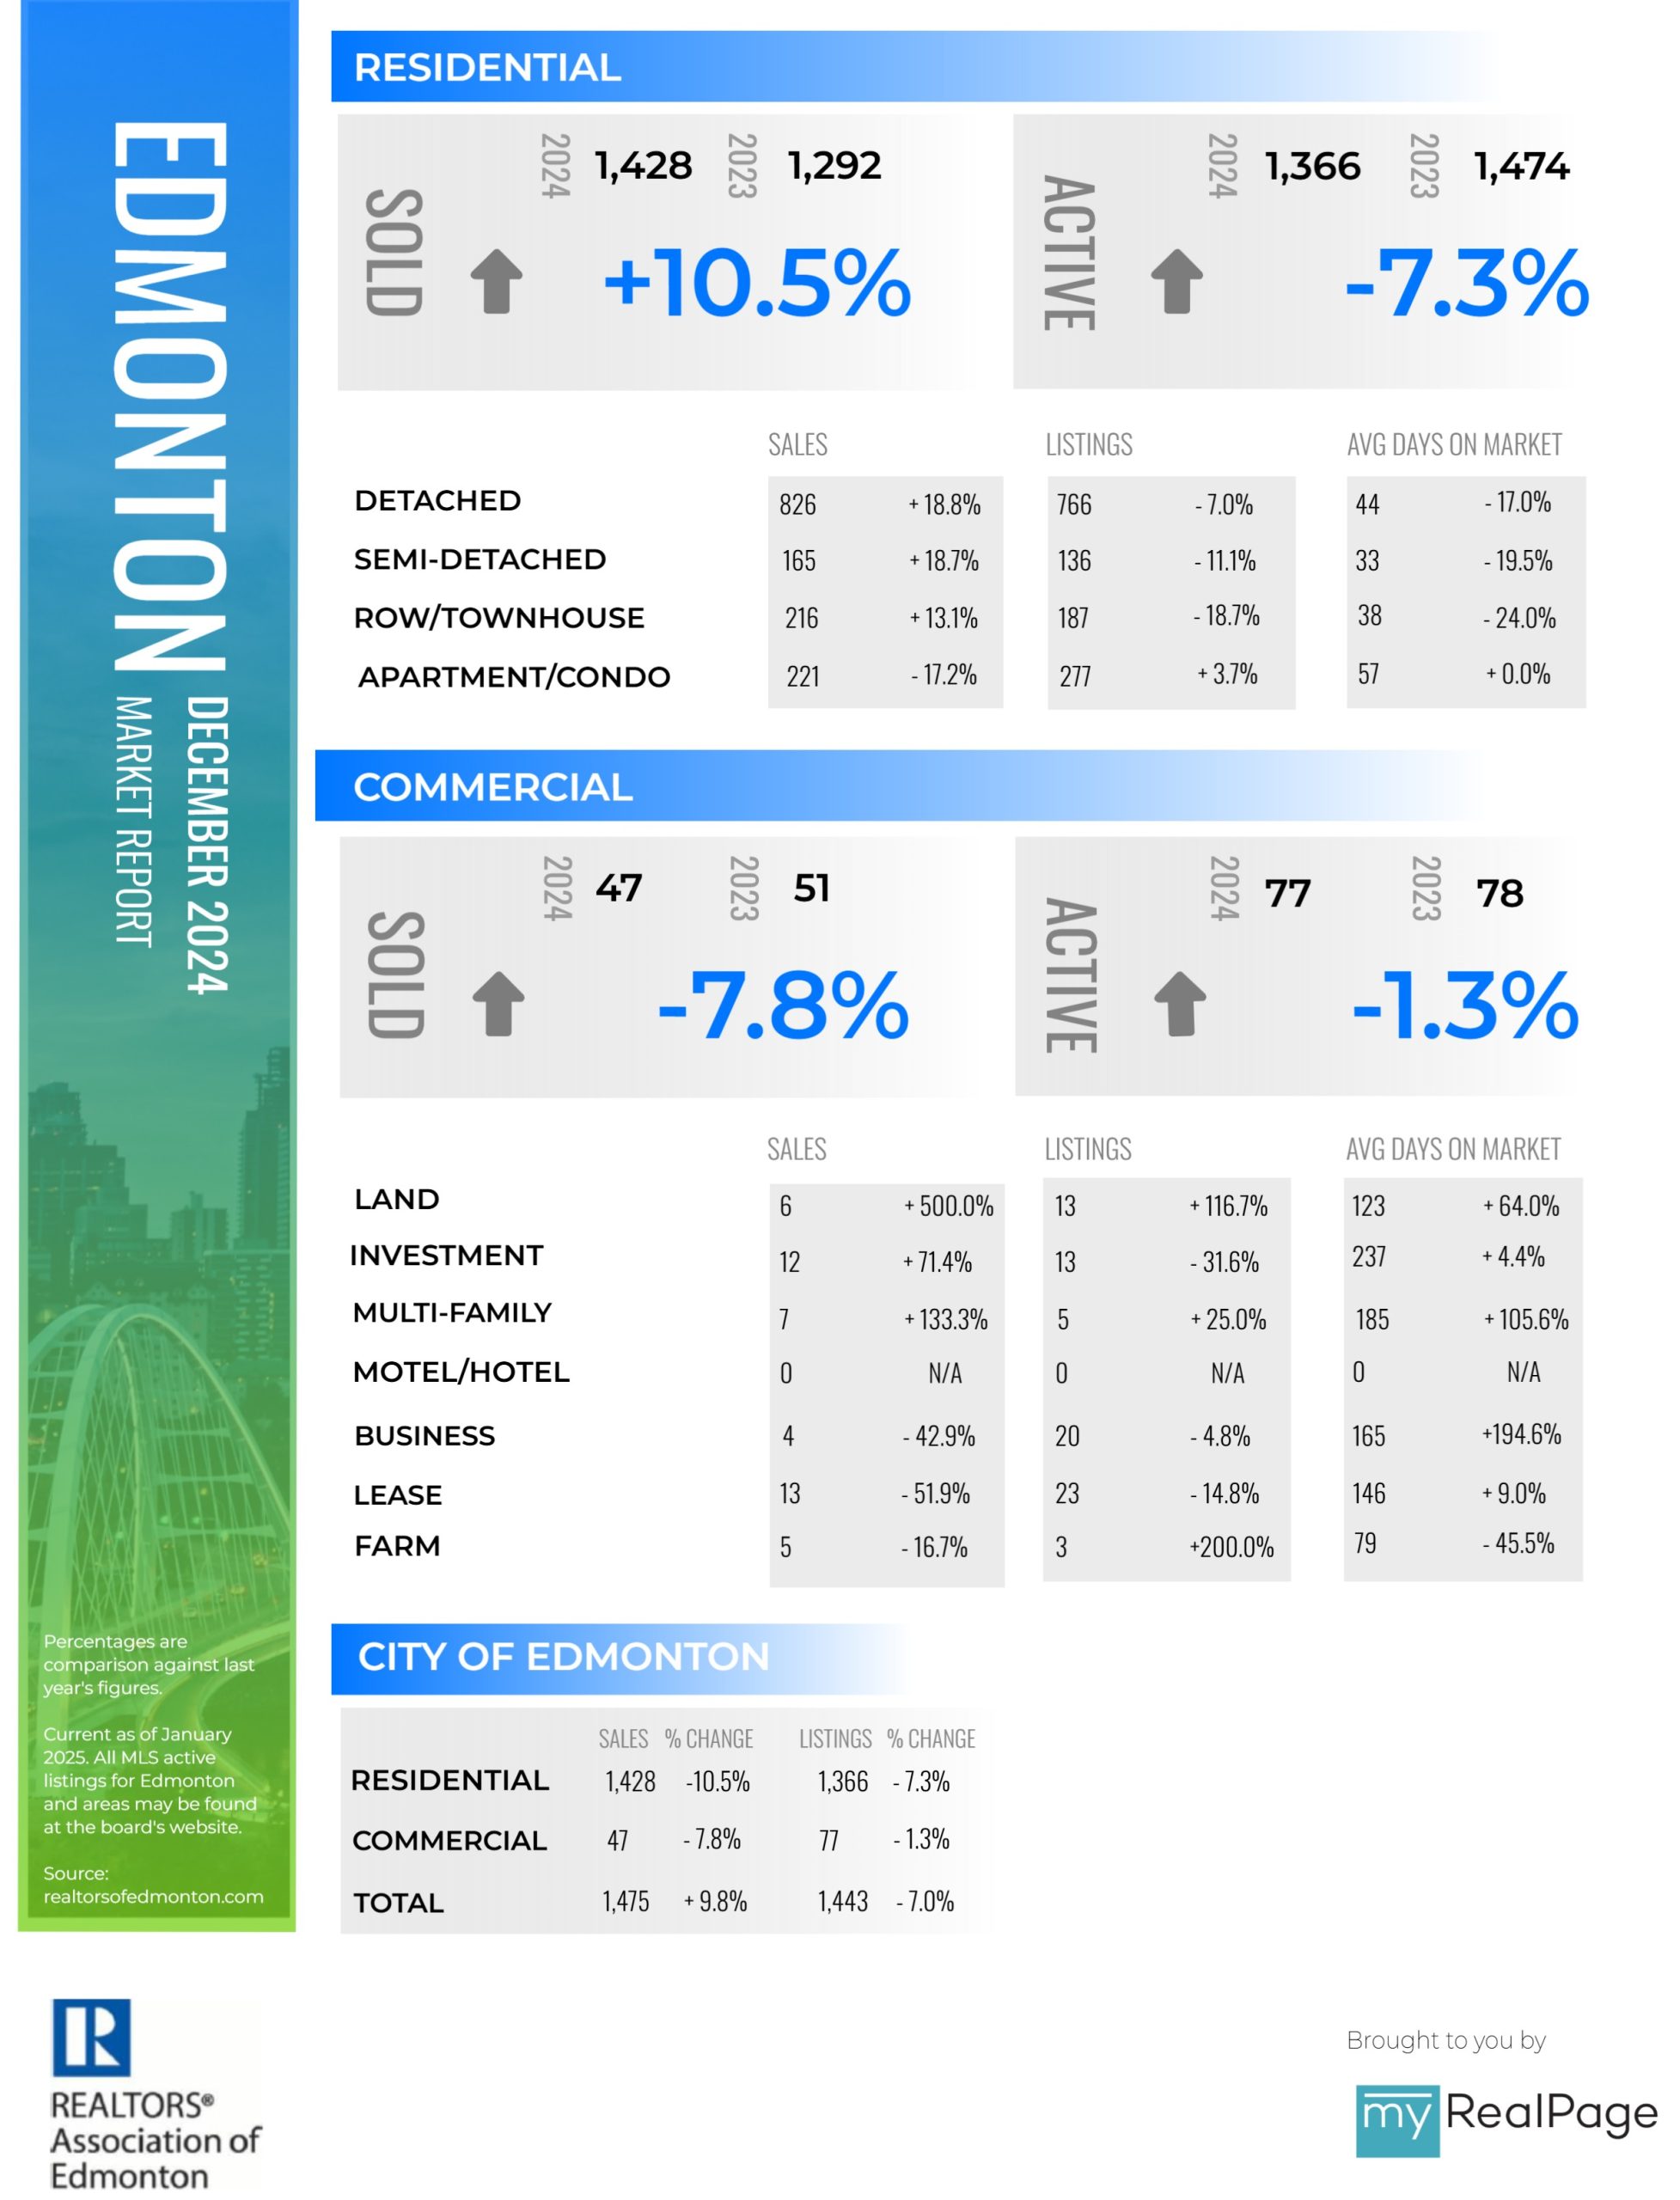
Low inventory sets stage for continued seller’s market
There were a total of 1,428 residential unit sales in the Greater Edmonton Area (GEA) real estate market during December 2024, a 25.4% decrease from November 2024 and 17.2% higher than December 2023. New residential listings amounted to 1,367, down 33.3% from November 2024 and 7.3% from December 2023. Overall inventory in the GEA decreased 22.5% month-over-month and 24.6% year-over-year.
The total number of Detached unit sales was 826, a decrease of 27.2% over the previous month but still 18.8% higher than the previous year. Semi-detached sales decreased 15.8% month-over-month while remaining 18.7% higher year-over-year, coming in at 165 units sold. Row/Townhouse unit sales decreased 22.9% compared to November 2024 and recorded 13.1% more sales than December 2023. Apartment Condominium unit sales are still 15.1% higher than the previous year but slowed 27.1% since November 2024.
Total residential average prices came in at $435,549, reporting no change from the previous month, but reflected an overall increase of 12.2% compared to December 2023. Detached homes averaged $540,232, with no change from November 2024, and coming in 10.6% higher than the previous year. Semi-detached units sold for an average of $408,823, increasing 1.6% from the previous month and up 12.3% year-over-year. Row/townhouse prices were up 1.4% from November 2024 and were 12.3% higher than December 2023 with an average selling price of $292,640. Apartment Condominium average prices rose 1.8% from November 2024 to $203,920, ending the month of December 19.8% higher than the previous year.
Read the full report on RAE website!
The following data is a comparison between December 2024 and December 2023 numbers, and is current as of January of 2025. For last month’s numbers, check out our previous RAE infographic!
You can also click here to view all our Edmonton infographics.
Download Printable Version – December 2024 RAE, Edmonton Report
Infographics: November 2024 RAE Edmonton Market Reports
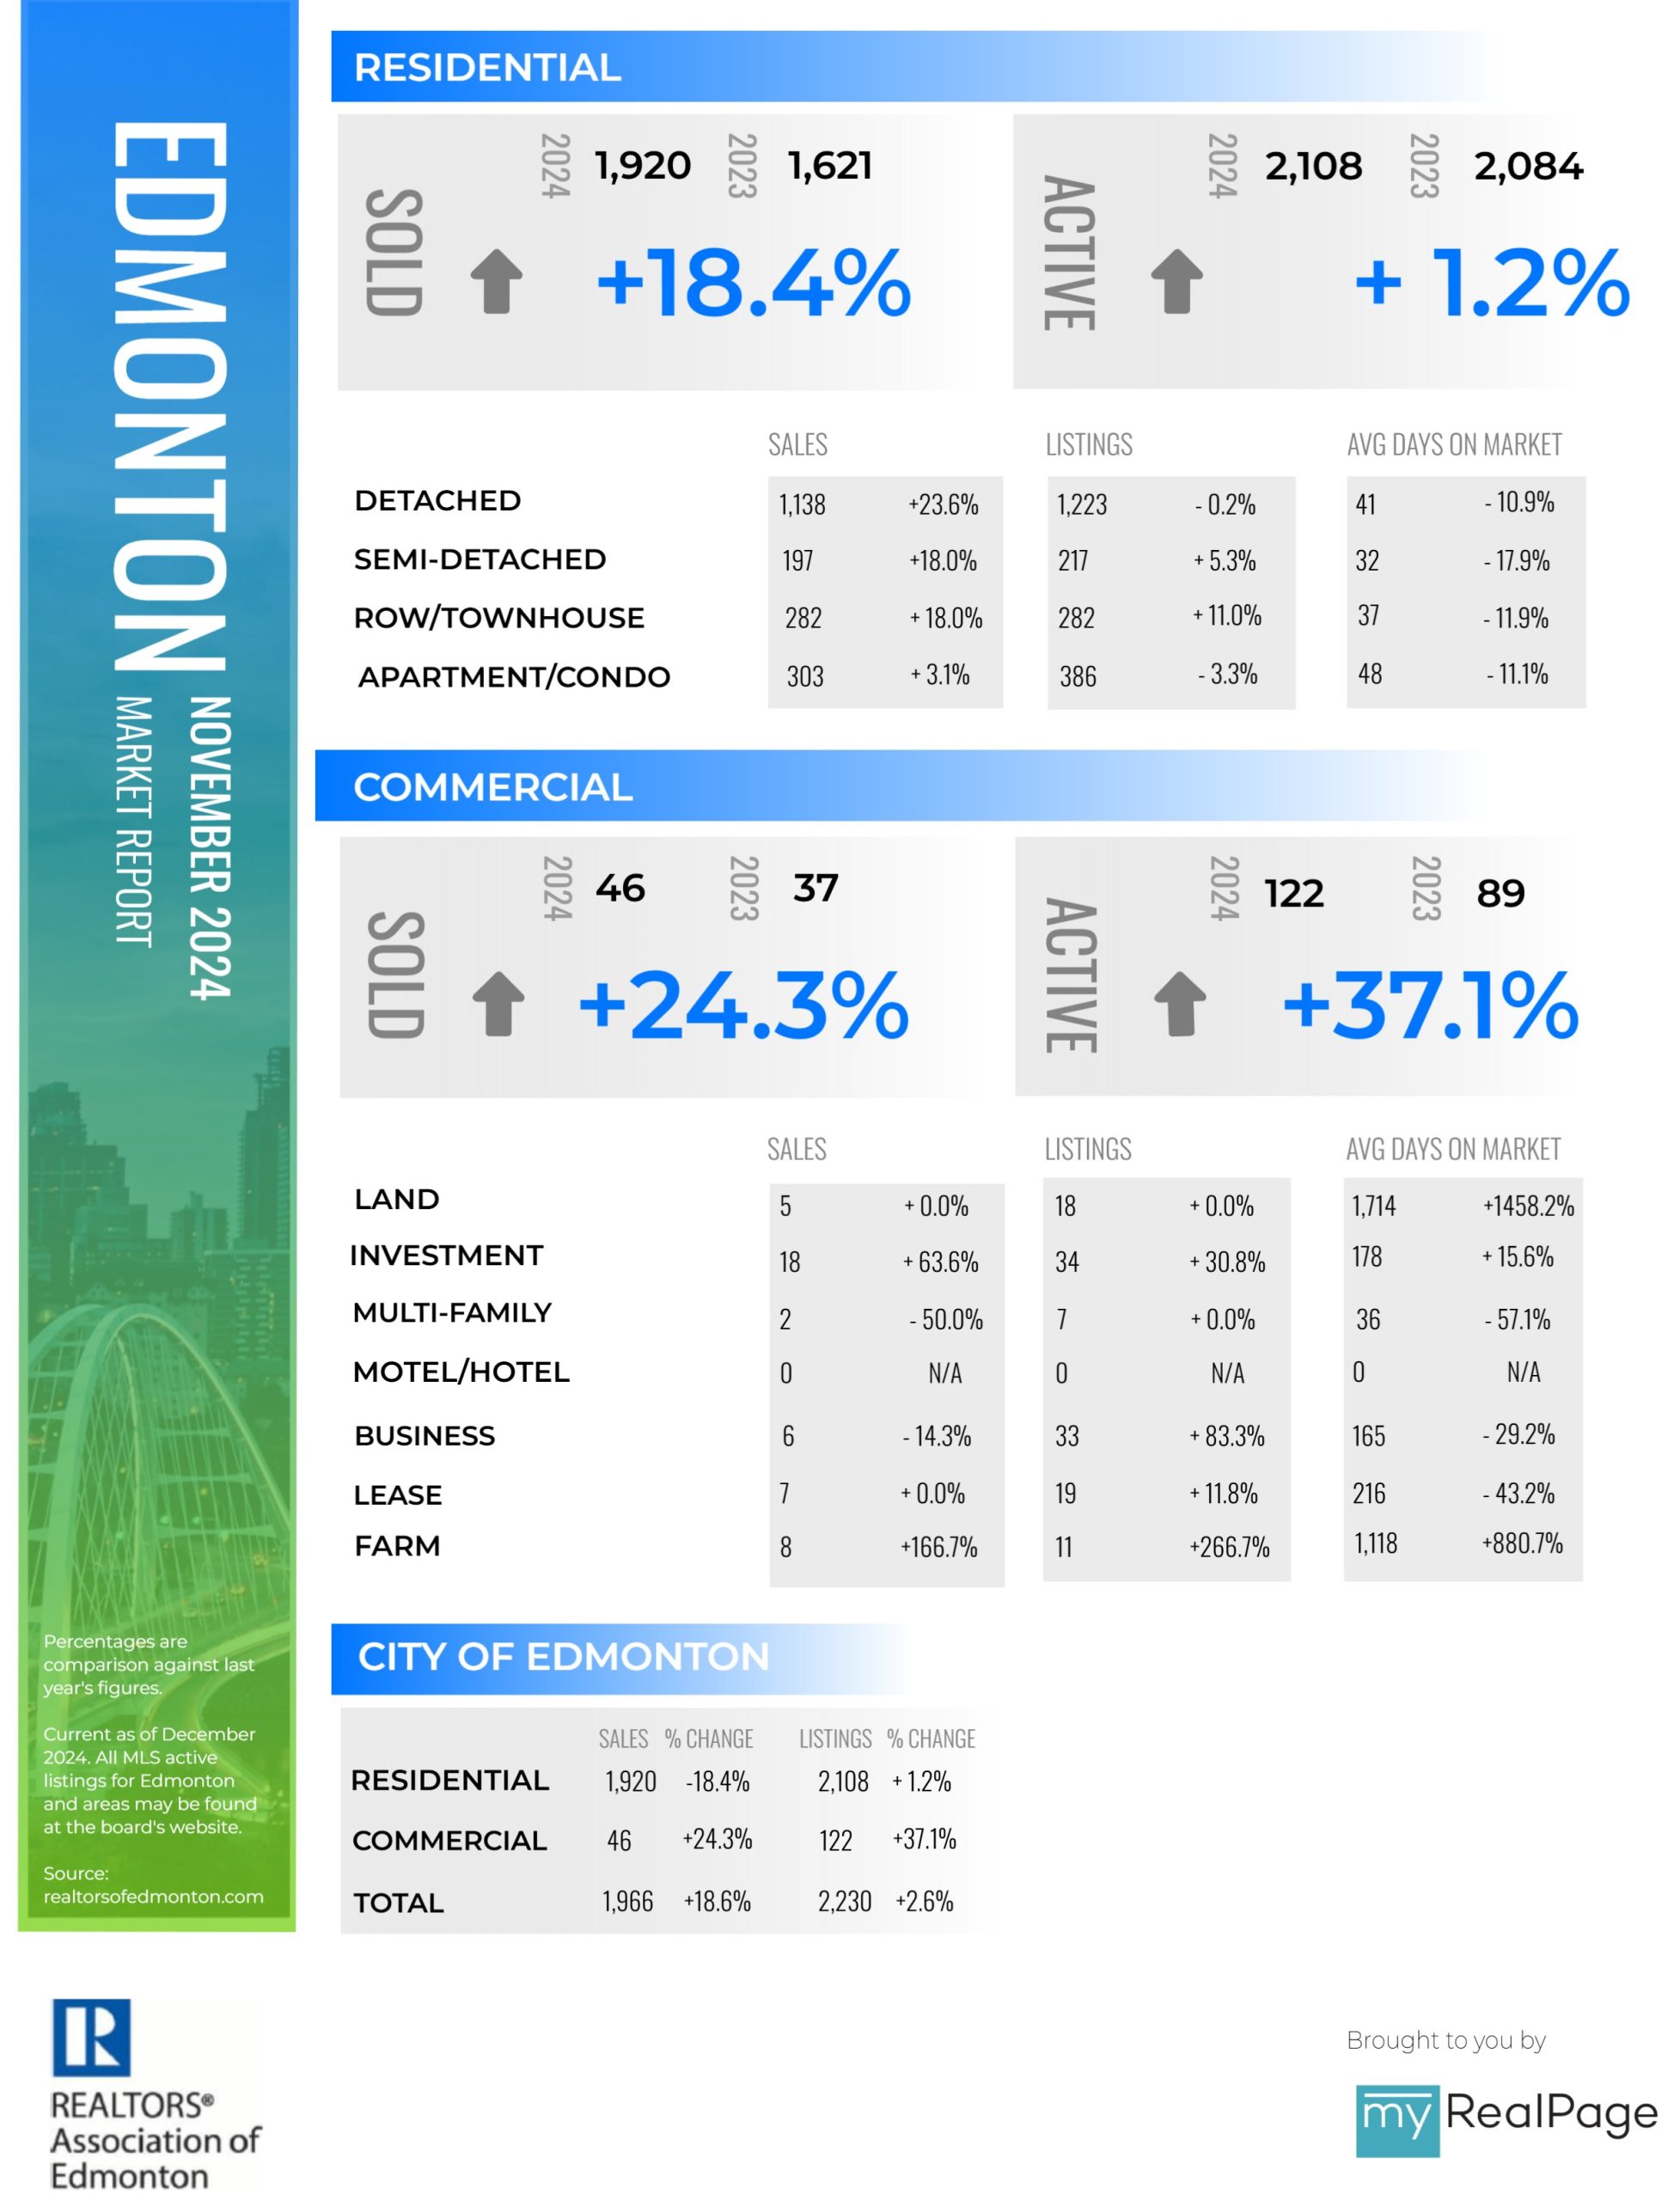
Winter cooling effect takes hold of Greater Edmonton property market
There were a total of 1,920 residential unit sales in the Greater Edmonton Area (GEA) real estate market during November 2024, a 22.8% decrease from October 2024 and 18.4% higher than November 2023. New residential listings amounted to 2,114, down 27.9% from October 2024 and up 1.4% from November 2023. Overall inventory in the GEA decreased 12.1% month-over-month and 17.3% year-over-year.
The total number of Detached unit sales was 1,138, a decrease of 20.5% over the previous month but 23.6% higher than the previous year. Semi-detached unit sales decreased 27.8% month-over-month while remaining 18.0% higher year-over-year. Row/Townhouse unit sales decreased 23.2% compared to October 2024 and recorded 18.0% more sales than in November 2023. Apartment Condominium unit sales are still 3.1% higher than the previous year but slowed 27.3% since October 2024.
Total residential average prices came in at $436,401, a 0.9% decrease from October 2024, but reflected an overall increase of 14.7% compared to November 2023. Detached homes averaged $540,320, a 2.3% decrease from October 2024, and coming in 12.8% higher than the previous year. Semi-detached units sold for an average of $411,469, increasing 1.1% from the previous month and up 13.3% year-over-year. Row/townhouse prices fell 6.4% from October 2024 but are still 6.0% higher than November 2023 with an average selling price of $288,176. Apartment Condominium average prices rose 4.5% from October 2024 to $200,266, ending the month of November 17.0% higher than the previous year.
Read the full report on RAE website!
The following data is a comparison between November 2024 and November 2023 numbers, and is current as of December 2024. For last month’s numbers, check out our previous RAE infographic!
You can also click here to view all our Edmonton infographics.
Download Printable Version – November 2024 RAE, Edmonton Report
Infographics: October 2024 RAE Edmonton Market Reports
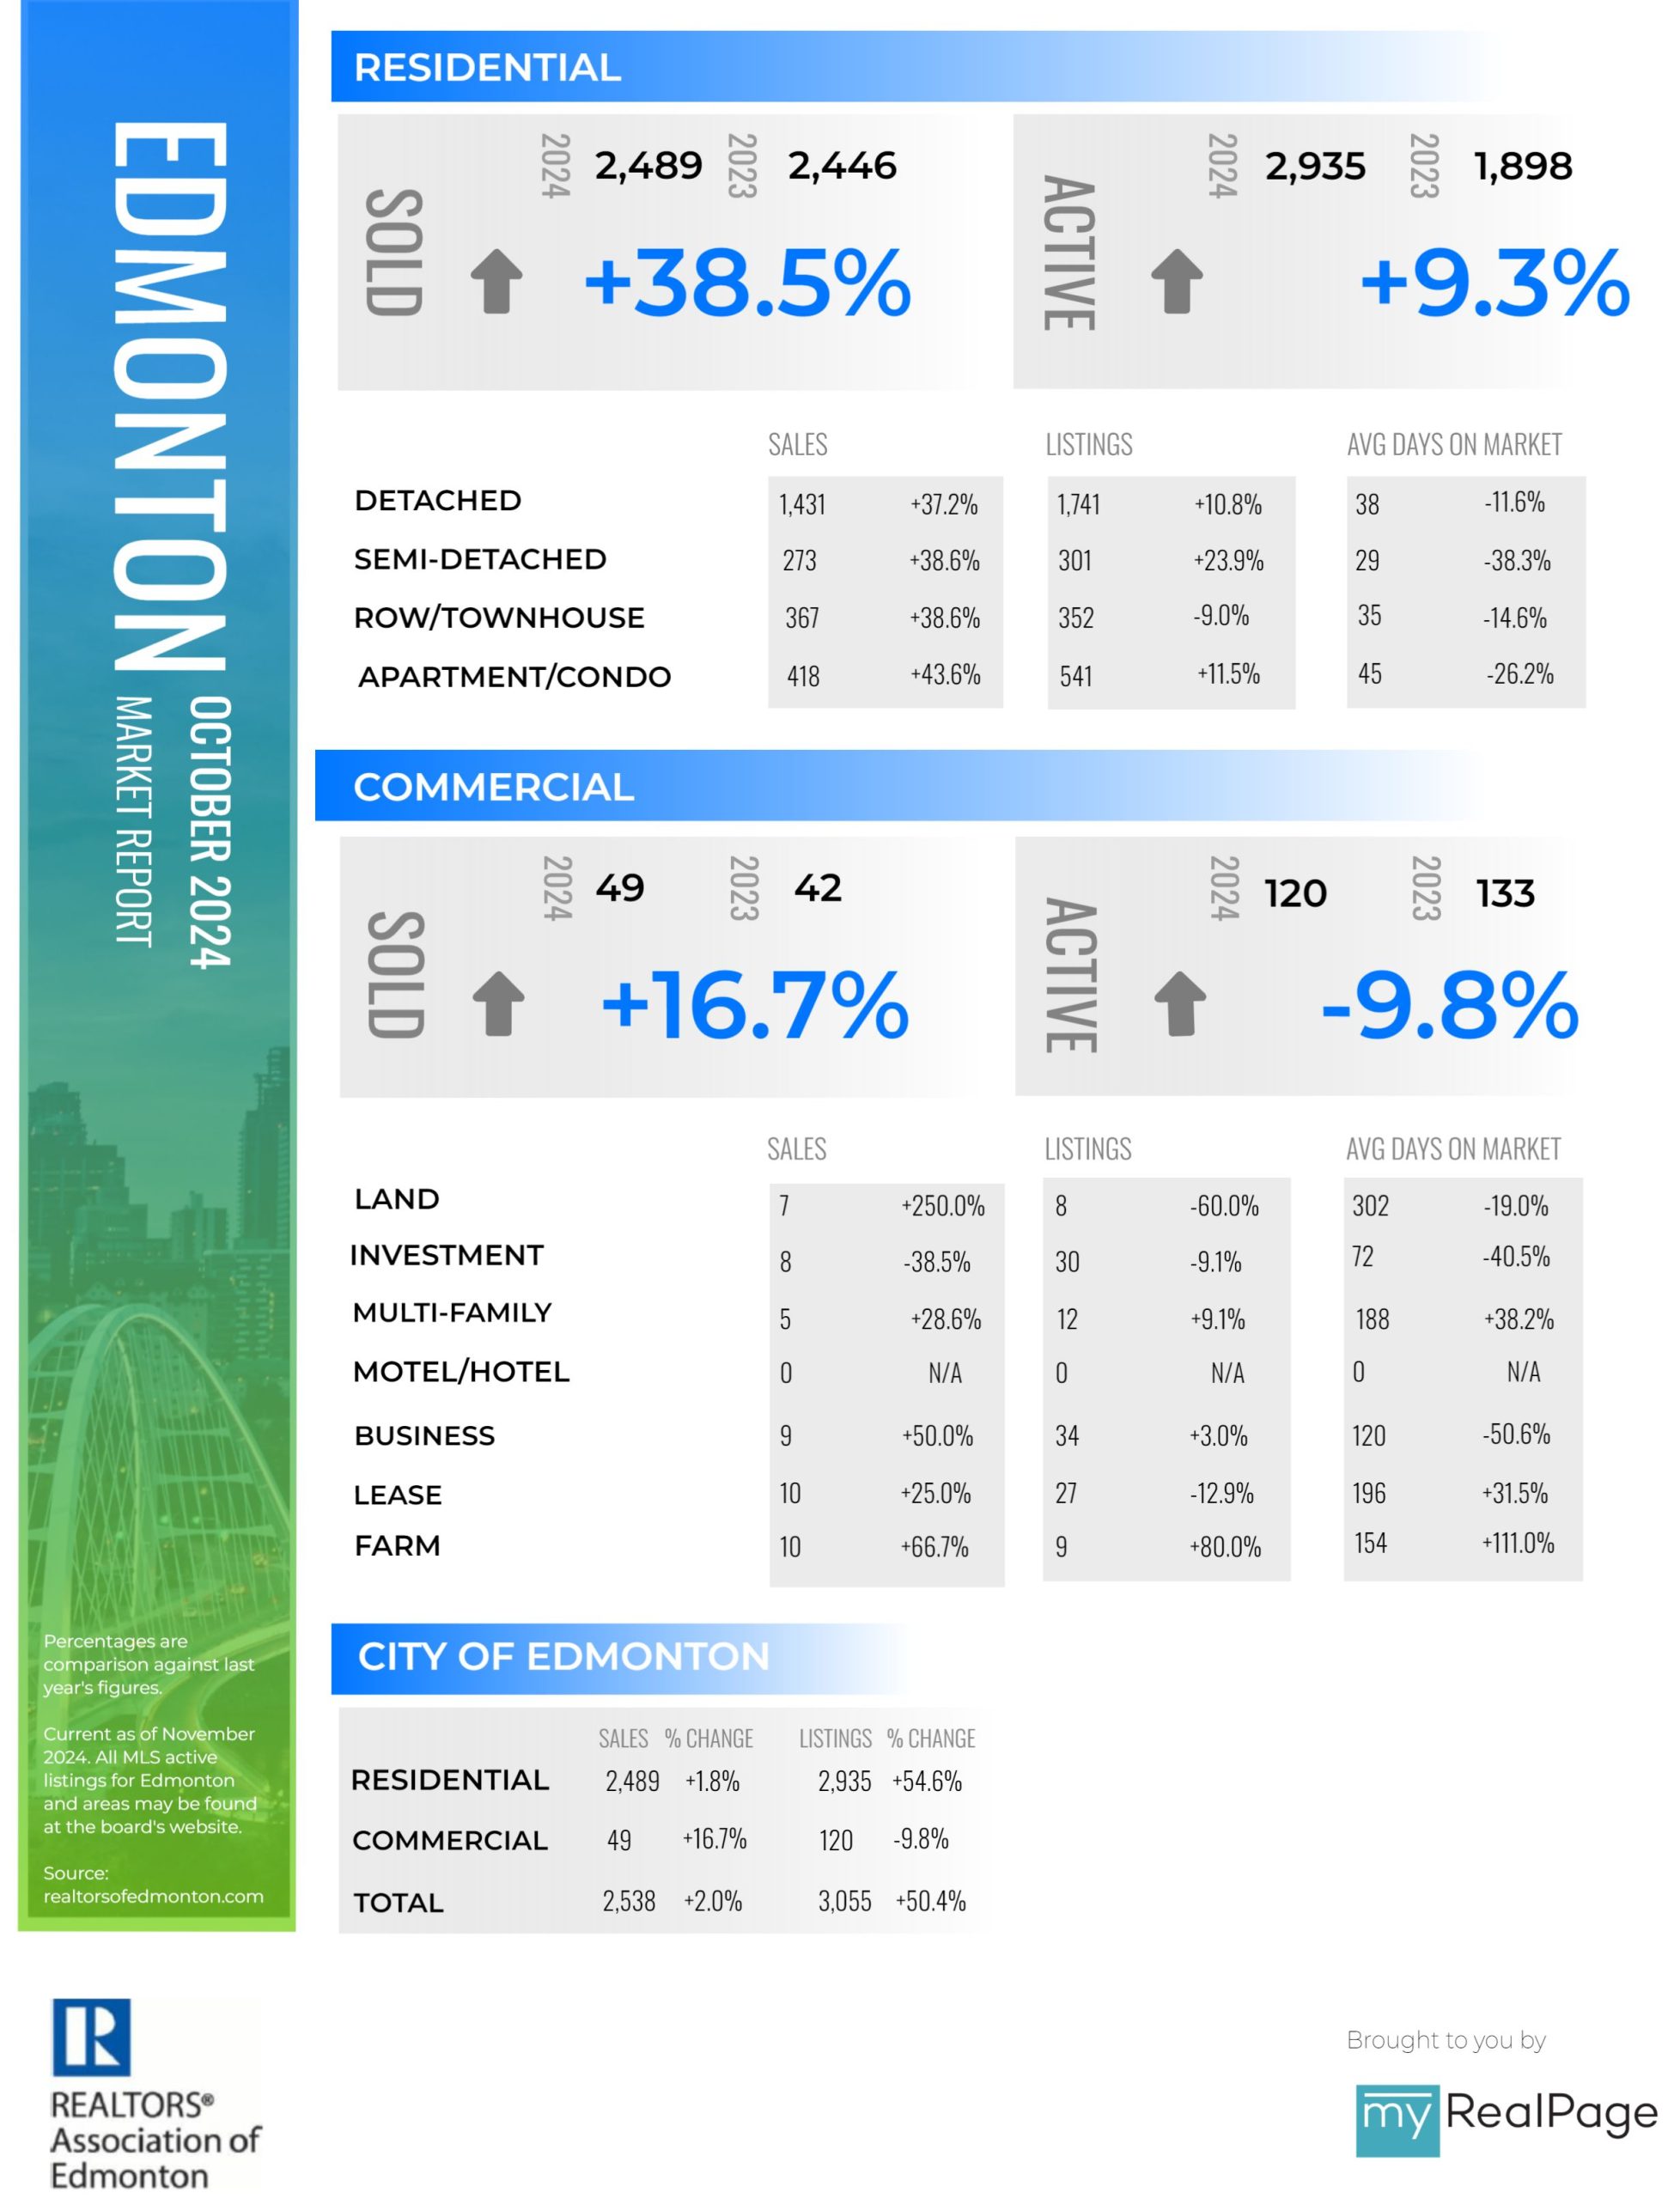
Interest Rate Impacts Adding Pressure to Edmonton Market
There were a total of 2,489 residential unit sales in the Greater Edmonton Area (GEA) real estate market during October 2024, a 10.5% increase from September 2024 and 38.5% higher than October 2023. New residential listings amounted to 2,934, down 8.7% from September 2024 and up 9.2% higher from October 2023. Overall inventory in the GEA decreased 10.1% month-over-month and sits 17.4% lower year-over-year.
The total number of Detached unit sales was 1,431, an increase of 10.2% over the previous month and 37.2% over the previous year. Semi-detached unit sales increased 11.4% month-over-month and 38.6% year-over-year. Row/Townhouse unit sales increased 6.7% compared to September 2024 and had 38.0% more sales than October 2023. Apartment Condominium unit sales were 43.6% higher than the previous year and 13.9% higher than September 2024.
Total residential average prices came in at $440,089, a 0.1% decrease from September 2024, but reflecting an overall increase of 11.1% compared to October 2023. Detached homes averaged $552,954, showing no change from September 2024 but still 13.6% higher than the previous year. Semi-detached units sold for an average of $407,006, decreasing 1.5% from the previous month and up 5.6% year-over-year. Row/townhouse prices rose 4.9% from September 2024 and sit 19.0% higher than October 2023 with an average selling price of $307,854. Apartment Condominium average prices dropped 4.1% from September 2024 to $191,413, ending the month of October 6.0% lower than the previous year.
Read the full report on RAE website!
The following data is a comparison between October 2024 and October2023 numbers, and is current as of November 2024. For last month’s numbers, check out our previous RAE infographic!
You can also click here to view all our Edmonton infographics.
Download Printable Version – October 2024 RAE, Edmonton Report
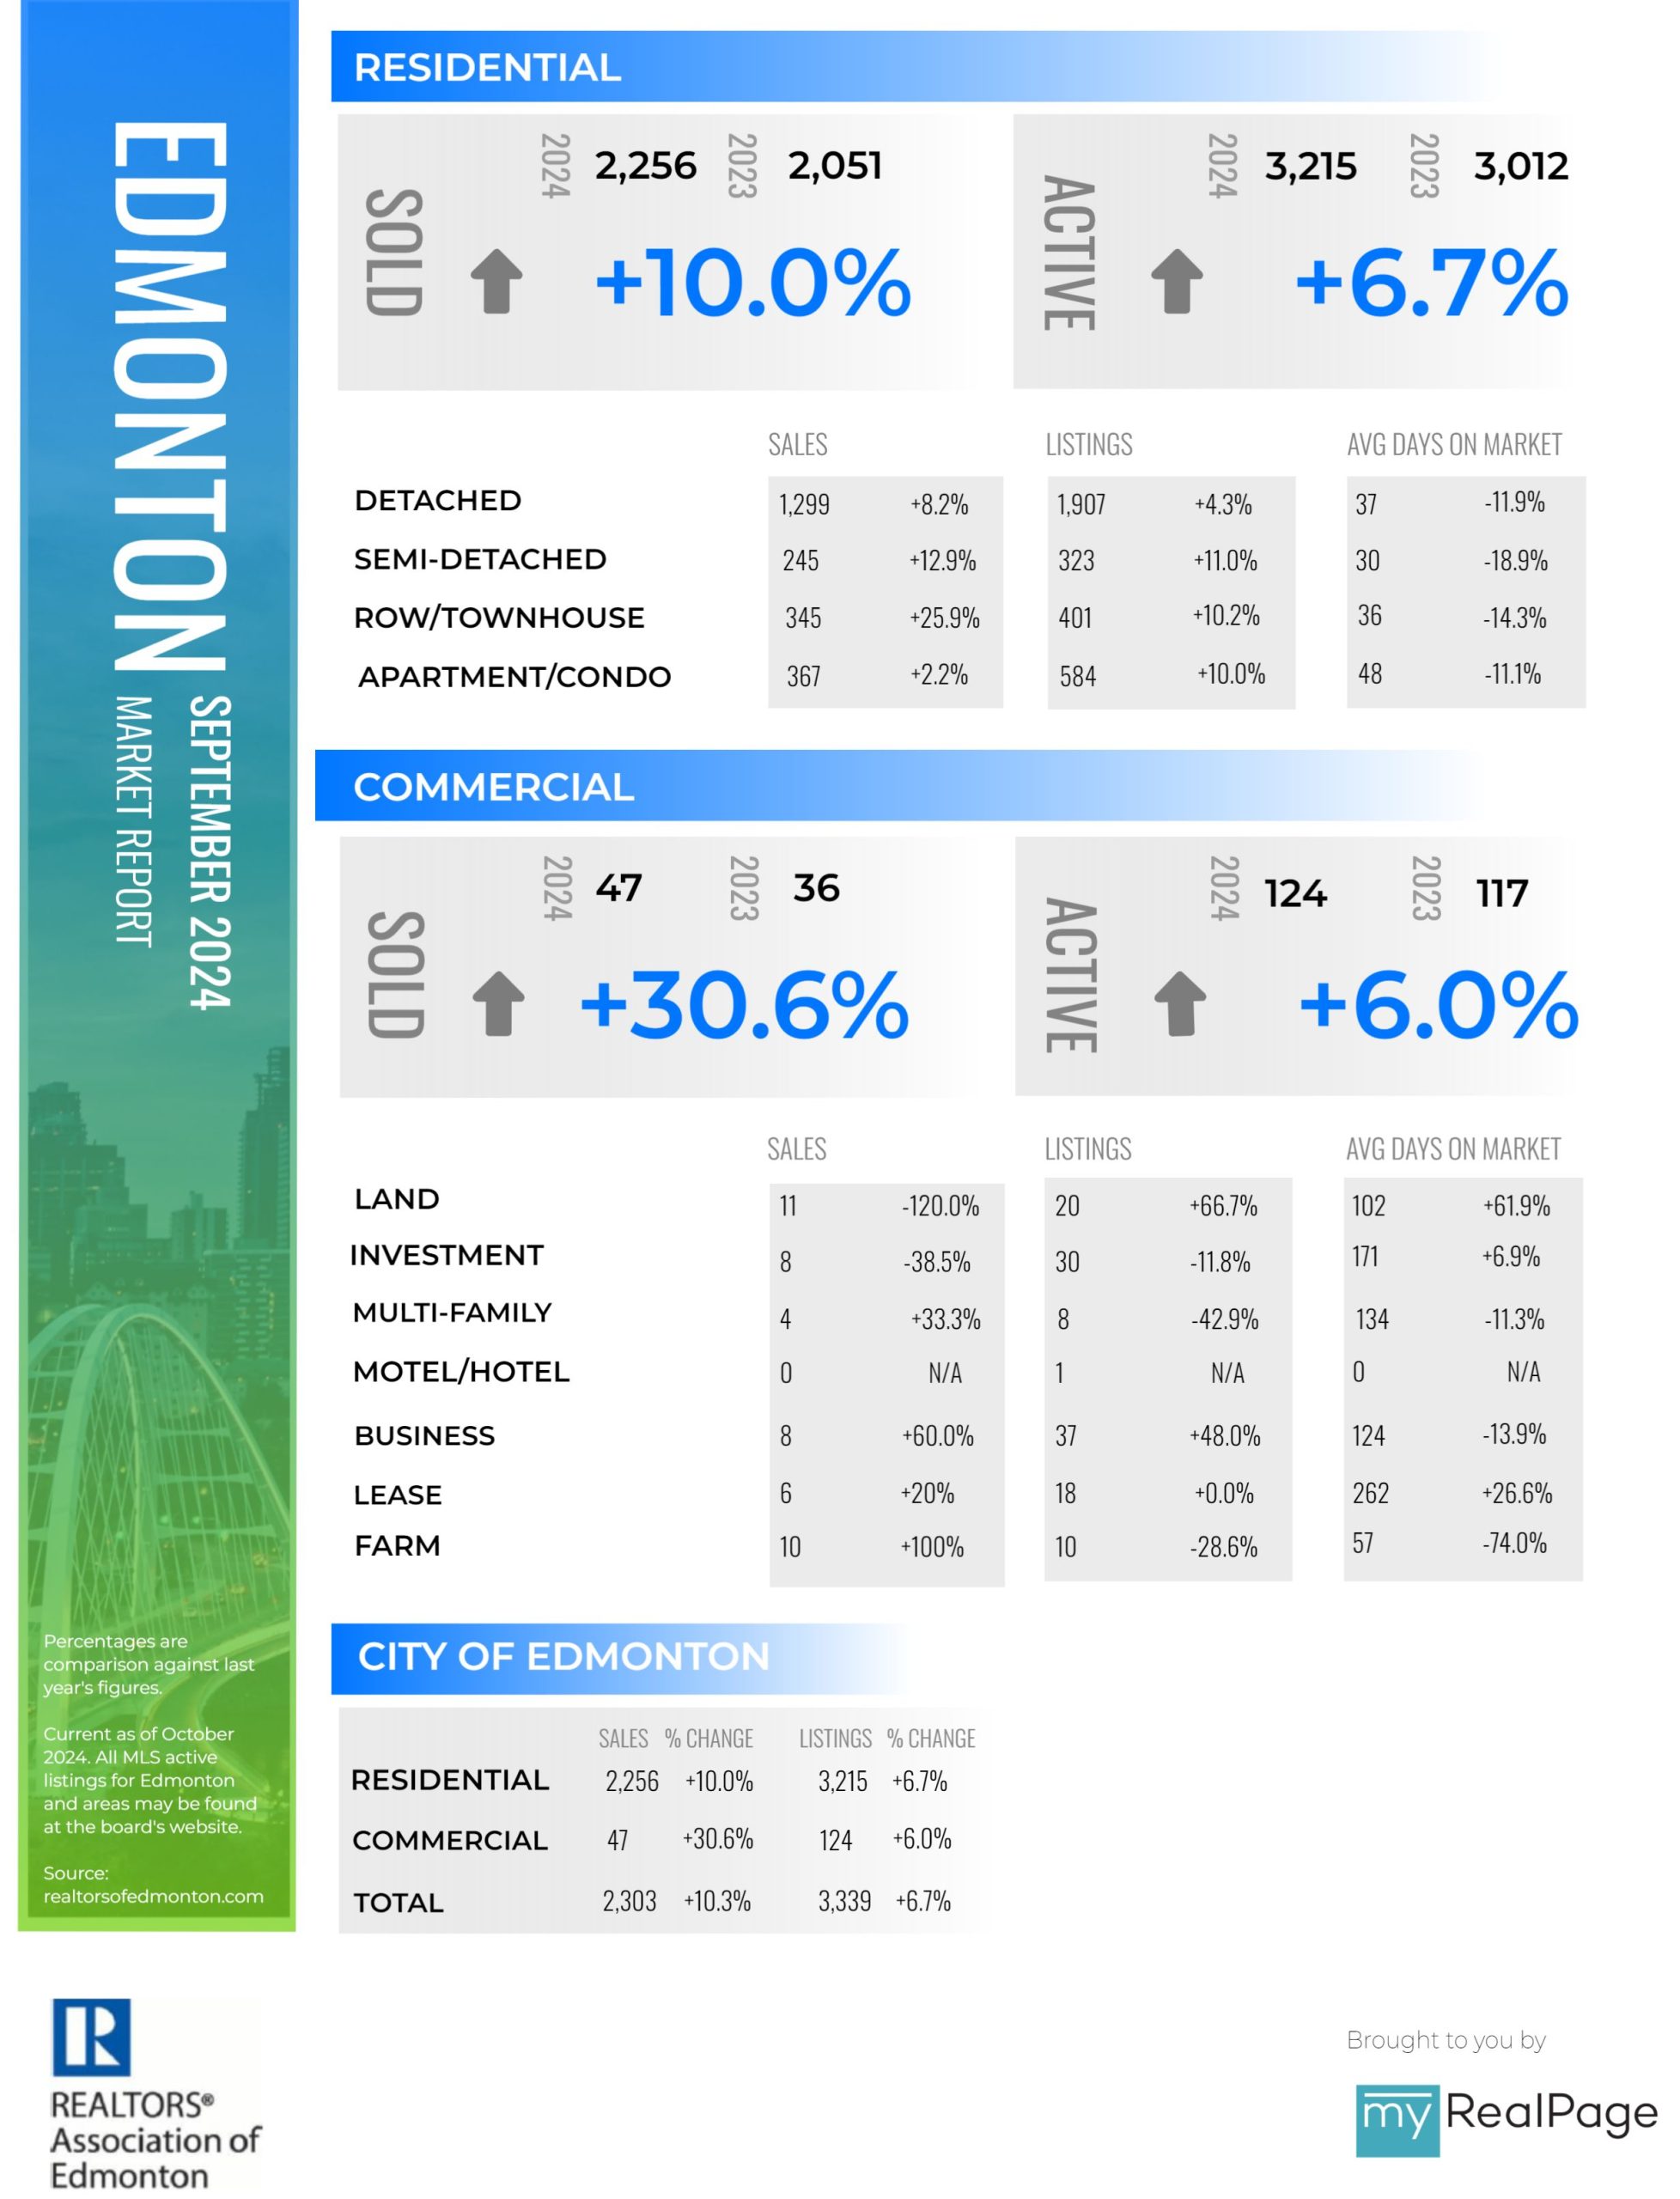
Infographics: September 2024 RAE Edmonton Market Reports
Predictable real estate patterns unaffected by interest rate changes
There were a total of 2,256 residential unit sales in the Greater Edmonton Area (GEA) real estate market during September 2024, a 12.6% decrease from August 2024, but still 10.0% higher than September 2023. New residential listings amounted to 3,215, down 4.6% from August 2024, and up 6.4% higher from September 2023. Overall inventory in the GEA decreased 1.7% month-over-month and 12.1% year-over-year.
The total number of Detached unit sales was 1,299, a decrease of 11.1% over the previous month but still 8.2% higher than the previous year. Semi-detached unit sales decreased 15.8% month-over-month and showed an increase of 12.9% year-over-year. Row/Townhouse unit sales decreased 15.4% compared to August 2024 and sold 25.9% more than September 2023. Apartment Condominium unit sales were still 2.2% higher than the previous year but were down 12.6% from August 2024.
Total residential average prices came in at $440,366, a 1.2% increase from August 2024, and a 11.7% increase from September 2023. Detached homes averaged $552,684, increasing 1.3% from August 2024 and up from the previous year by 11.9%. Semi-detached units sold for an average of $413,252, decreasing 0.3% from the previous month, and up 16.8% year-over-year. Row/townhouse prices rose 0.7% from August 2024 and are sitting 9.6% higher than September 2023 with an average selling price of $292,875. Apartment Condominium average prices dropped 2.3% in August 2024 to $199,564, ending the month of September 9.6% higher than the previous year.
Read the full report on RAE website!
The following data is a comparison between September 2024 and September 2023 numbers, and is current as of October 2024. For last month’s numbers, check out our previous RAE infographic!
You can also click here to view all our Edmonton infographics.
Download Printable Version – September 2024 RAE, Edmonton Report